

sent on february 21, 2025
If you’ve ever had to bust out a straight-edge and pencil to extract data from a graph, you’ll be a fan of PlotDigitizer.
From the company: PlotDigitizer is an online data extraction tool that allows users to extract data from images in numerical format. In short, it reverse-engineers your visual graphs into numbers.
I use the tool often to get a more detailed look at graphs in papers or books. This week I was examining how the roll rate of a motorcycle develops as it falls to the roadway due to a front tire lock. Fortunately, Ed Fatzinger, Jon Landerville, Jeff Bonsall, and Daniel Simacek conducted excellent, on-point testing and published the results here.
The paper includes graphs of the roll rate, but not in tabular form. However, you can screenshot the graph, import it into PlotDigitizer, map the curve, and export the data to Excel for further analysis. In this case, I wanted to establish the acceleration profile of the roll rate, which is easy to do with a plot of the roll rate. The interface is straightforward and easy to use.
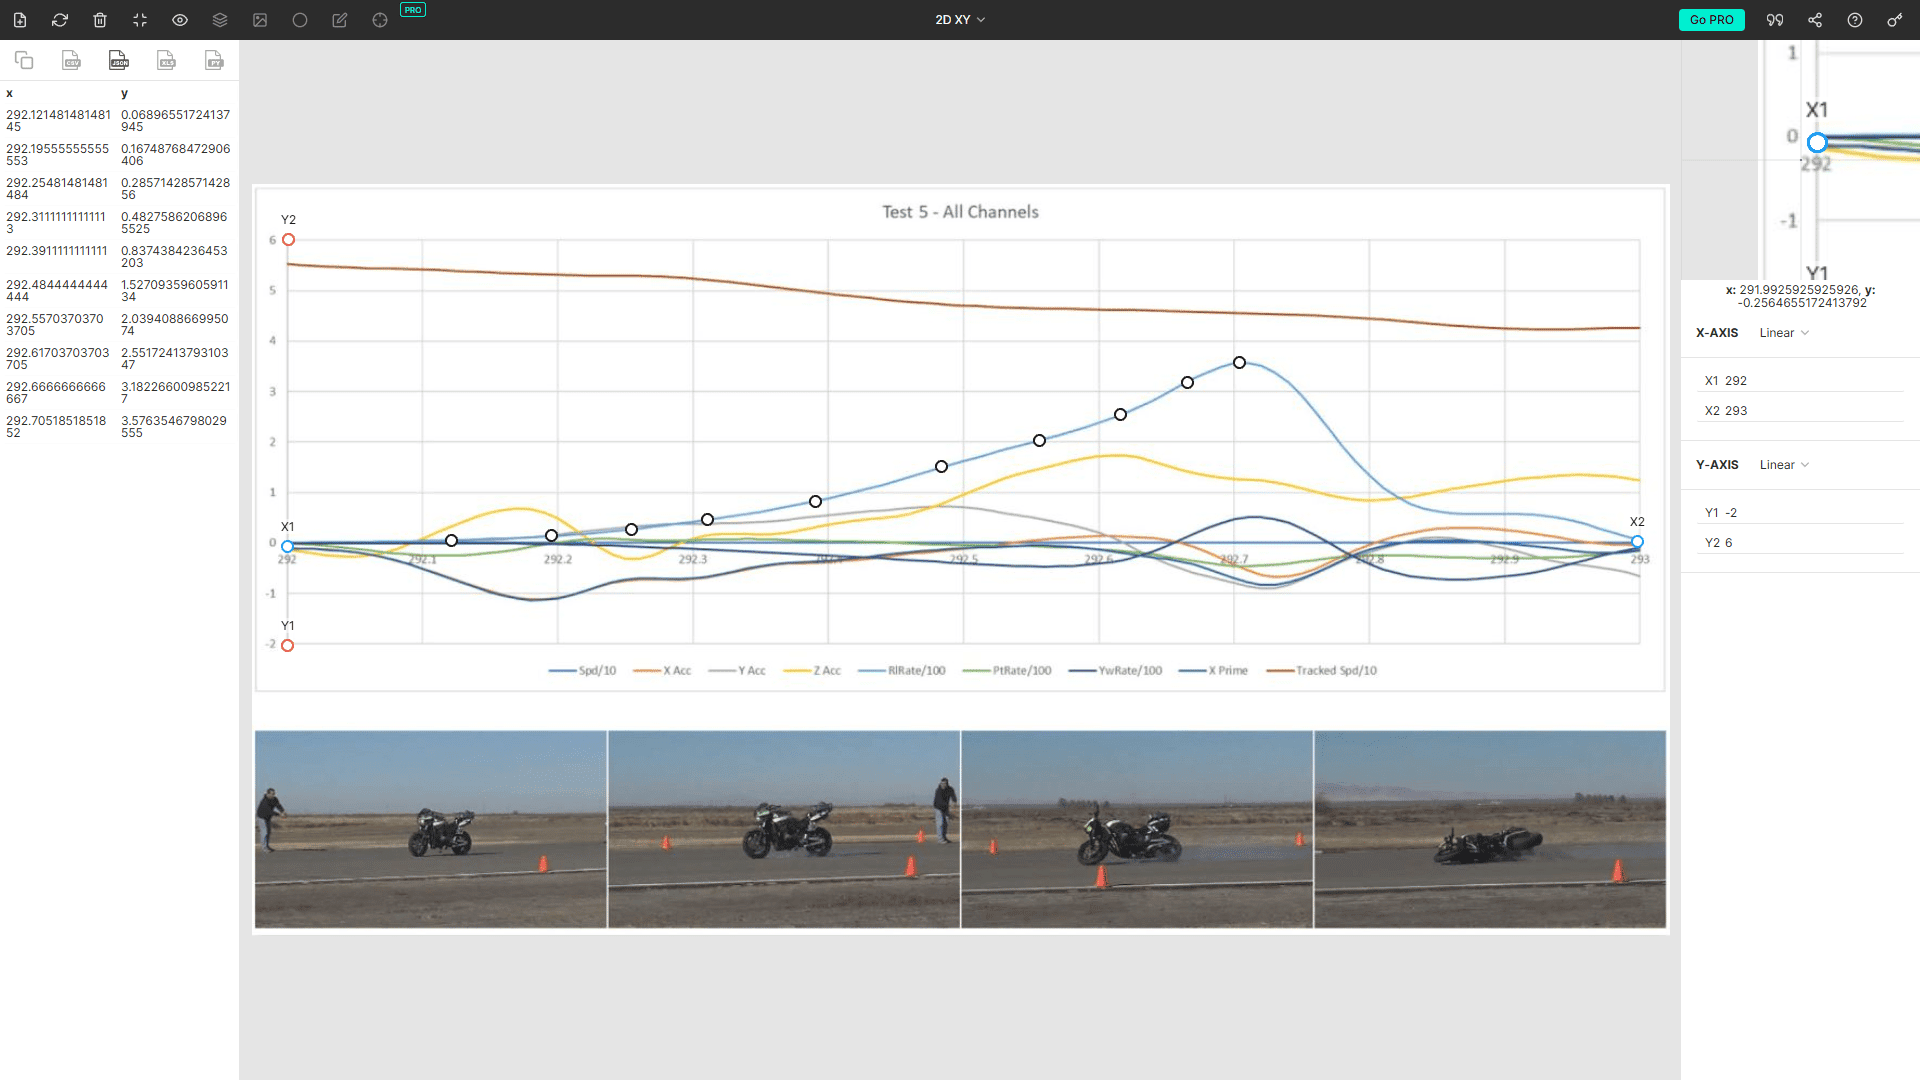
Figure A5 from SAE Paper 2019-01-0426, as seen in the PlotDigitizer interface.
To digitize a plot, head to the site and:
Click Launch App
Drag the image into the app, or click the icon to upload it
Left click to drag the axes definitions to the appropriate positions
Define the values for the axes defined above
Left click anywhere on the graph to determine a value
The above can be performed with the free version. The paid version ($40 for individuals and $80 for businesses) can apparently detect and automatically trace lines. ChatGPT isn’t far away from being able to accomplish that either, but I haven’t found it to be reliable enough for forensic work. However, their o3-mini-high model is great for all sorts of scientific tasks, as is the nascent Grok3… I’ll touch on some of those shortly.
Thanks for reading, keep exploring!
Lou Peck
Lightpoint | Axiom